OFSTED & Performance Data
Please find below our most recent Ofsted reports and relevant information from the Department for Education Performance Tables.
Ofsted Report
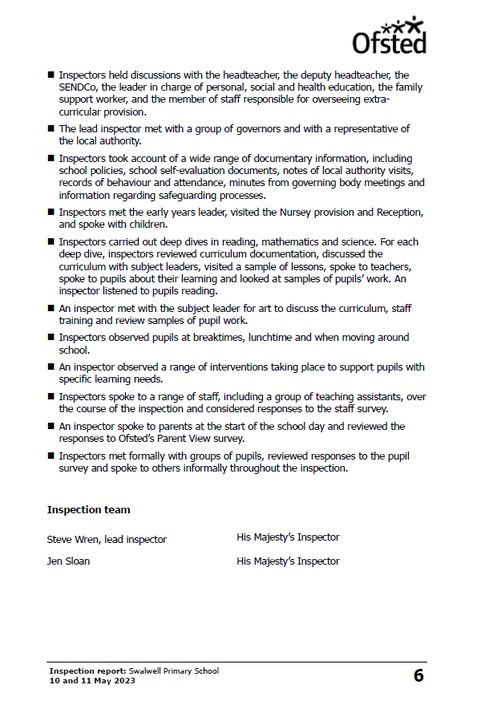
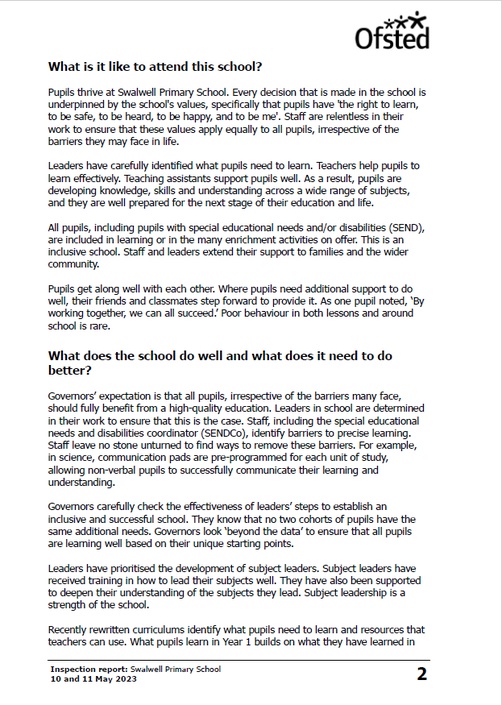
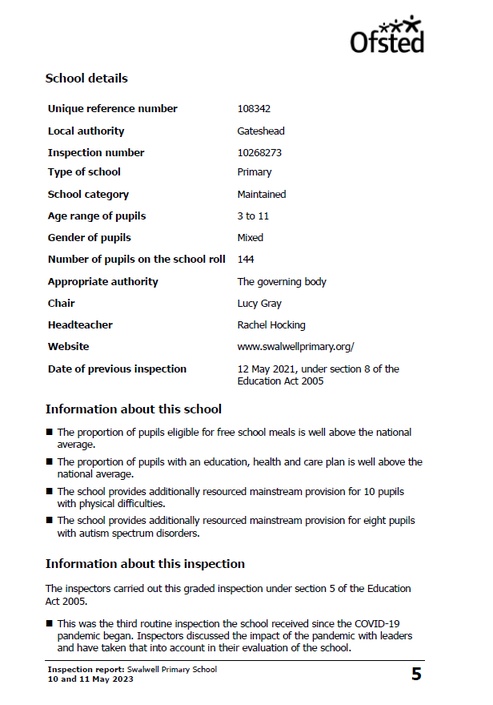
Our school was recently inspected by Ofsted on 10 and 11 May 2023.
Swalwell Primary School is judged as a GOOD school with OUTSTANDING features.
You can view the full report below.
- Ofsted Report June 2023
- Ofsted Monitoring Inspection Report June 2021
- Ofsted Remote Monitoring Inspection Report March 2021
- Swalwell Primary Ofsted Report - June 2019
- Ofsted Website
- Ofsted Parent View
Financial Benchmarking Service
Please click the below link to view the financial benchmarking for Swalwell Primary School
There are no staff members with a gross annual salary of £100,000 or more.
Further Information
The latest school performance tables.
-
Department for Education Swalwell Primary School Performance Table
-
Department for Education School Performance Tables
Published Results 2022-23
Phonics Screen (Year 1):
22 children in cohort; 8 SEND (incl. 3 ARMS)
65.2% pass rate (15 children)
Data with mainstream learners only 75%
Phonics Screen (Year 2):
4 children in cohort to re-sit.
75% pass rate (83 children)
By the end of Year 2; 94.4% passed (17 children).
Key Stage One Results (Year 2):
18 children in cohort; 9 SEND (incl. 3 EHCPs).
Reading:
55% pass rate (10 children)
Data with mainstream learners only 62.5%
Greater depth: 5% (1 child)
Writing:
50% pass rate (9 children)
Data with mainstream learners only 56%
Greater depth: 5% (1 child)
Maths:
61% pass rate (11 children)
Data with mainstream learners only 68.5%
Greater depth: 5% (1 child)
Combined:
50% pass rate (9 children)
Data with mainstream learners only 56%
Key Stage Two Results (Year 6):
22 children in cohort; 7 SEND (incl. 5 EHCPs):
Reading:
ARE: 59% pass rate (13 children) GD: 9%(2 children)
ARE: Data with mainstream learners only 76.4% GD: 15%
Writing:
ARE: 50% pass rate (11 children)
ARE: Data with mainstream learners only 65%
Maths:
ARE: 54.5% pass rate (12 children)
ARE: Data with mainstream learners only 67%
SPAG:
ARE: 54.5% pass rate (12 children)
ARE: Data with mainstream learners only 67%
Combined:
50% pass rate (11 children)
Data with mainstream learners only 65%
Published Results 2021-22
Phonics Screen (Year 1):
17 children in cohort; 4 SEND (incl. 1 ARMS)
82% pass rate (14 children)
Data with mainstream learners only 88% (14 children)
Phonics Screen (Year 2):
9 children in cohort; 2 SEND (incl. 1 ARMS)
87.5% pass rate (8 children)
Data with mainstream learners only 100% (8 children) (data by the end of Year 2)
Key Stage One Results (Year 2):
9 children in cohort; 2 SEND (incl. 1 ARMS). Very small cohort.
Reading:
55.6% pass rate (5 children)
Data with mainstream learners only 62.5% (5 children)
Writing:
55.6% pass rate (5 children)
Data with mainstream learners only 62.5% (5 children)
Maths:
87.5% pass rate (8 children)
Data with mainstream learners only 75% (6 children)
Combined:
66.7% pass rate (6 children)
Data with mainstream learners only 62.5% (5 children)
Key Stage Two Results (Year 6):
22 children in cohort; 6 SEND
| ARE | ARE | GD | GD | ARE (GD) | |
|
|
Test Outcome |
Teacher Assessment |
Test
|
Teacher Assessment
|
National |
|
Reading |
50% (11 children) |
59.1% (13 children) |
4.5% (1 child) |
5% (1 child) |
75% (28%) |
|
Writing |
|
54.5% (12 children) |
|
|
69% (13%) |
|
Maths |
36.4% (8 children) |
50% (11 children) |
4.5% (1 child) |
|
72% (23%) |
|
GPS |
72.7% (16 children) |
50% (11 children) |
4.5% (1 child) |
|
73% (28%) |
| Science | 59.1% (13 children) | 79% | |||
|
RWM |
27.3% (6 children) |
45% (11 children) |
|
|
59% (7%) |
Comparative results for academic years 2019-2020 and 2020-2021 are unavailable due to the COVID-19 pandemic.
Year 6 SAT’s Results May 2019 (Not current due to COVID-19 pandemic)
| All Y6 Pupils | All Y6 Pupils |
| Average Progress Scores in Reading | -4 |
| Average Progress Scores in Writing | 0 |
| Average Progress Scores in Maths | -3.5 |
| Average Scaled Score in Reading | 97 |
| Average Scaled Score in Grammar, Punctuation and Spelling | |
| Average Scaled Score in Maths | 98 |
| % of children meeting ARE in Reading | 29.6% |
| % of children meeting ARE in Writing | 77.8% |
| % of children meeting ARE in Maths | 59.3% |
| % of children GD in Reading | 3.7% |
| % of children GD in Writing | 0 |
| % of children GD in Maths | 0 |
Combined RWM 22%
National average 65%
Year 6 SAT’s Results May 2018
| All Y6 Pupils | ||
| Average Progress Scores in Reading | 1.9 | |
| Average Progress Scores in Writing | -1.0 | |
| Average Progress Scores in Maths | -2.5 | |
|
86% of pupils had progress measured (19 pupils) 3 pupils, all EAL, no progress could be measured. |
||
|
All Y6 Pupils 2017 |
All Y6 Pupils 2018 |
|
| Average Scaled Score in Reading | 102 | 104 |
| Average Scaled Score in Grammar, Punctuation and Spelling | 102 | 109 |
| Average Scaled Score in Maths | 96 | 100 |
Combined RWM 64%
National average 64%
|
All Y6 Pupils 2017 |
All Y6 Pupils 2018 |
|
| Percentage Achieving Expected Standard or above in Reading | 53% | 82% |
| Percentage Achieving Expected Standard or above in Writing | 67% | 73% |
| Percentage Achieving Expected Standard or above in GPS | 60% | 86% |
| Percentage Achieving Expected Standard or above in Maths | 27% | 68% |
|
All Y6 Pupils 2017 |
All Y6 Pupils 2018 |
|
| Percentage Achieving High Level of Attainment in Reading | 20% | 32% |
| Percentage Achieving High Level of Attainment in Writing | 13% | 9% |
| Percentage Achieving High Level of Attainment in GPS | 13% | 59% |
| Percentage Achieving High Level of Attainment in Maths | 0% | 0% |
Trends from 2016 – 2018
| 2016 | 2017 | 2018 | ||
| Average Progress Scores in Reading | -4 | 2.8 | 1.9 | |
| Average Progress Scores in Writing | 1.8 | 1.2 | -1.0 | |
| Average Progress Scores in Maths | -5.7 | -3.2 | -2.5 | |
| 2016 | 2017 | 2018 | ||
| Average Scaled Score in Reading | 89.7 | 102 | 104 | |
| Average Scaled Score in Grammar, Punctuation and Spelling | 102 | 109 | ||
| Average Scaled Score in Maths | 94.7 | 96 | 100 | |
| 2016 | 2017 | 2018 | ||
| Percentage Achieving Expected Standard or above in Reading | 46.7% | 53% | 82% | |
| Percentage Achieving Expected Standard or above in Writing | 73.3% | 67% | 73% | |
| Percentage Achieving Expected Standard or above in GPS | 73.3% | 60% | 86% | |
| Percentage Achieving Expected Standard or above in Maths | 40% | 27% | 68% | |
| 2016 | 2017 | 2018 | ||
| Percentage Achieving High Level of Attainment in Reading | 0% | 20% | 32% | |
| Percentage Achieving High Level of Attainment in Writing | 20% | 13% | 9% | |
| Percentage Achieving High Level of Attainment in GPS | 7% | 13% | 59% | |
| Percentage Achieving High Level of Attainment in Maths | 0% | 0% | 0% | |
Year 6 SAT’s Results May 2017
Year 6 Exam Results May 2016
15 children completed Year 6 SAT’s 2016, 2 children were disapplied.
Percentage achieving Expected Standard or above
| Percentage Achieving Expected Standard or above in Reading | 46.70% |
| Percentage Achieving Expected Standard or above in Writing | 73.30% |
| Percentage Achieving Expected Standard or above in GPS | 73.30% |
| Percentage Achieving Expected Standard or above in Maths | 40% |
Percentage achieving high level of attainment
| Percentage Achieving High Level of Attainment in Reading | 0% |
| Percentage Achieving High Level of Attainment in Writing | 20% |
| Percentage Achieving High Level of Attainment in GPS | 7% |
| Percentage Achieving High Level of Attainment in Maths | 0% |
| All Y6 Pupils | Without pupils Disapplied from Test | |
| Average Progress Scores in Reading | -4.0 | -2.57 |
| Average Progress Scores in Writing | 1.8 | 3.9 |
| Average Progress Scores in Maths | -5.7 |
-4.28 |
Average Progress
| All Y6 Pupils | Without pupils Disapplied from Test | |
| Average Scaled Score in Reading | 89.73 | 91.38 |
| Average Scaled Score in Maths | 94.7 | 97.2 |
Year 6 SAT’s Analysis 2015
Out of the cohort of 11, 7 were boys, 9 were disadvantaged, 2 had English as an additional language (EAL) and 5 had been identified as having SEN.
For one child there were no Key Stage 1 results.
In reading, 80% made expected progress and 40% made more than expected progress (above national rates 33%).
In writing, 90% made expected progress and 50% made more than expected progress (above national rates – 36%).
In maths, 60% made expected progress and 10% made more than expected progress.
Out of the disadvantaged group, 8 of the 9 made expected progress in reading and writing, 6 of the 9 made expected progress in maths. The children identified as having SEN all made expected progress in writing. 4 of the 5 made expected progress in reading and 3 made expected progress in maths. 1 child with EAL made expected progress in all subjects. There were no KS1 results for the other child.
In reading 73% achieved the expected standard and 18% were above the expected standard. Boys’ attainment was higher than girls at the expected standard. Those eligible for pupil premium funding attained well.
In writing 91% attained the expected standard (above national – 87%) and 18% above the expected standard. Girls’ achievement was better than boys’. Those eligible for pupil premium funding attained similarly to other children nationally.
In Grammar, Punctuation and Spelling 73% achieved the expected standard, 9% attained above the expected standard. Boys and girls attainment was similar at the expected standard. Those eligible for pupil premium funding did not achieve as well as other children.
In maths 55% attained the expected standard, 0% attained above the expected standard, attainment of boys and girls was similar.
